TGA
totalgolfanalysis.co.uk
Homepage  |  Contact Us
  • About TGA
    • The TGA team
    • Testimonials
    • News from TGA
  • Our services
    • 3D analysis
      • Golf BioDynamics
      • In-depth guide
      • A typical 3D session
      • Output - Reports
      • Output - Graphs
      • Output - Images
      • Output - Videos
    • Biofeedback training
    • Golf conditioning
    • Tailored services
    • More:
      • Case studies
      • FAQs
      • Fees
  • Where and when
    • Forthcoming events
    • Venues
      • Selsdon Park tuition
      • Styal Golf Club
  • Resources
    • Articles
    • Golf news headlines
    • Website links

The 3D Golf BioDynamics System

Overview GBD In-Depth 3D Sessions Reports Graphs Images Video

Sample Images

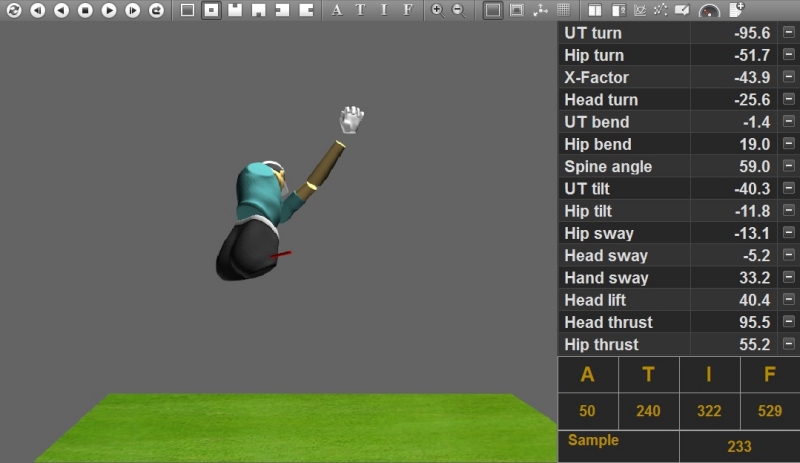
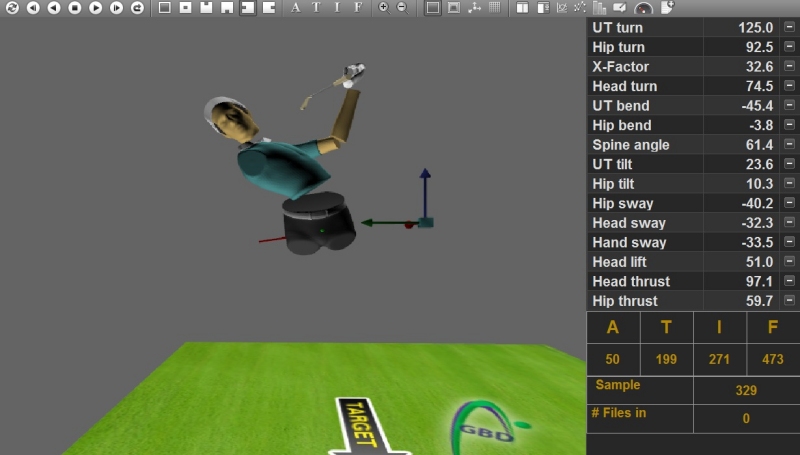
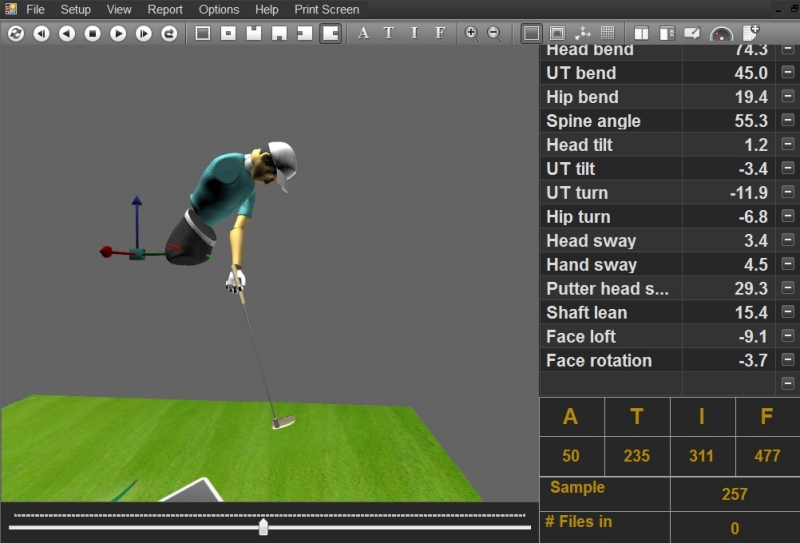
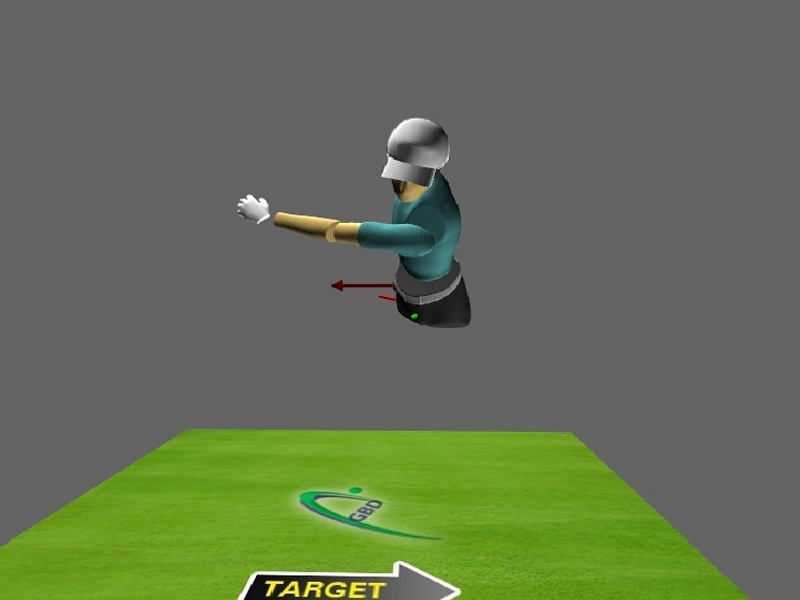
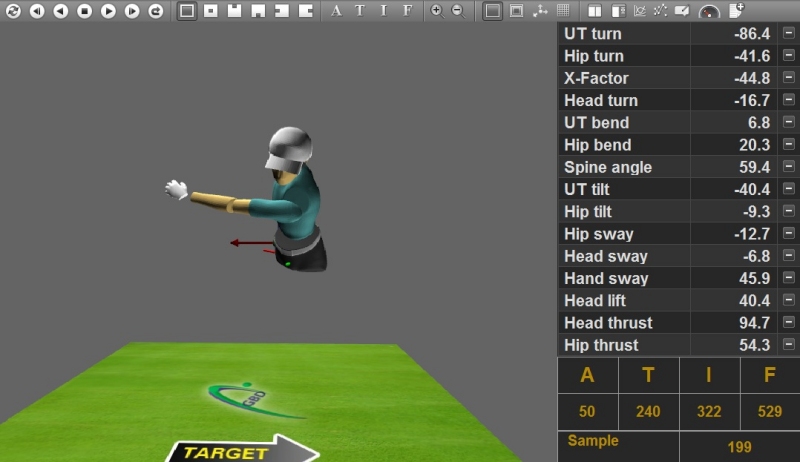
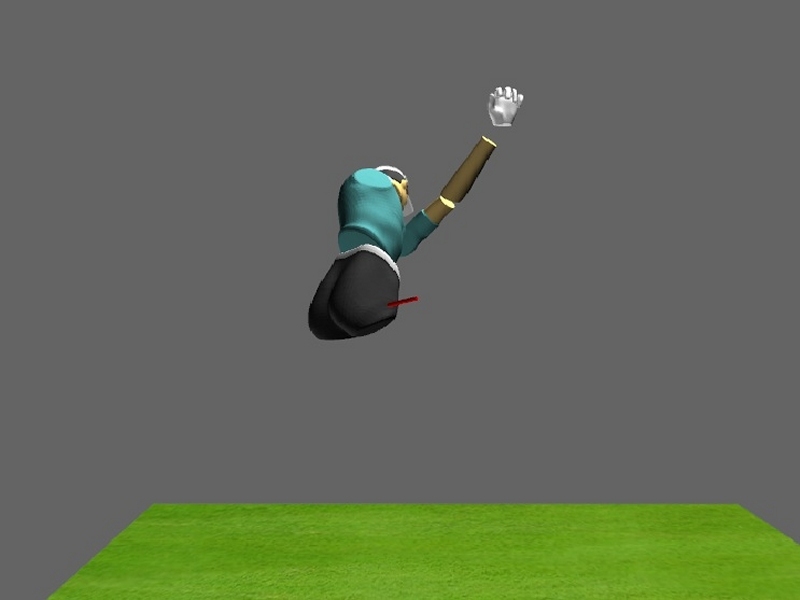
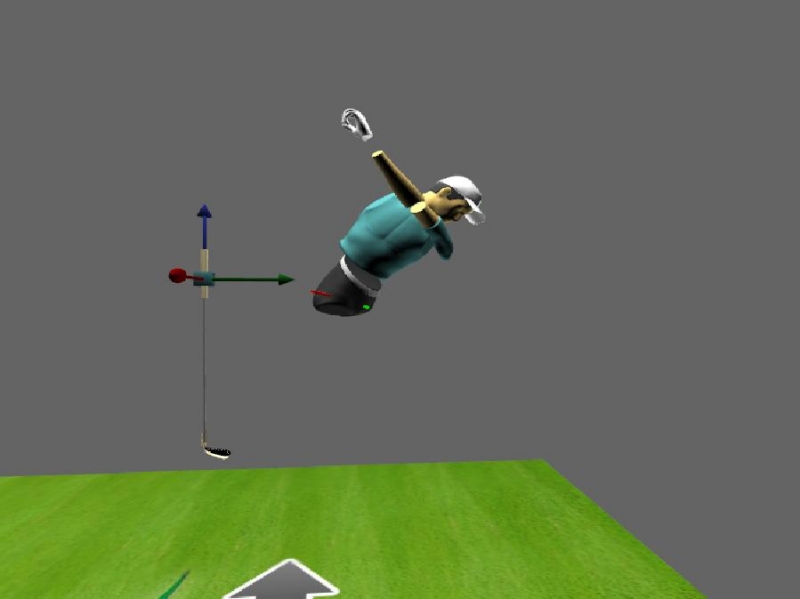
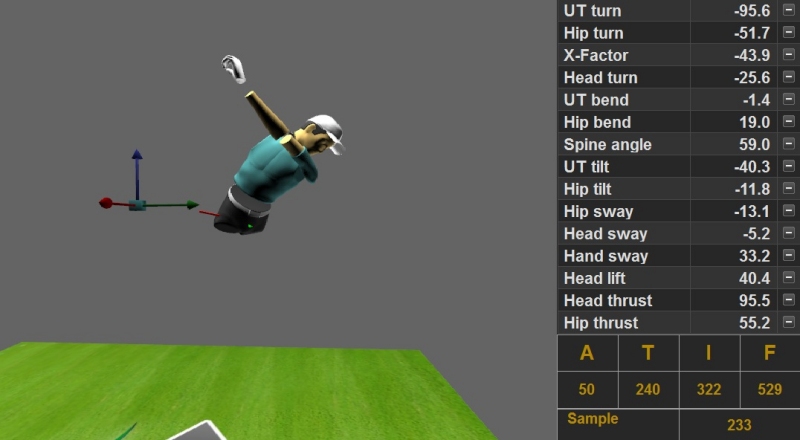
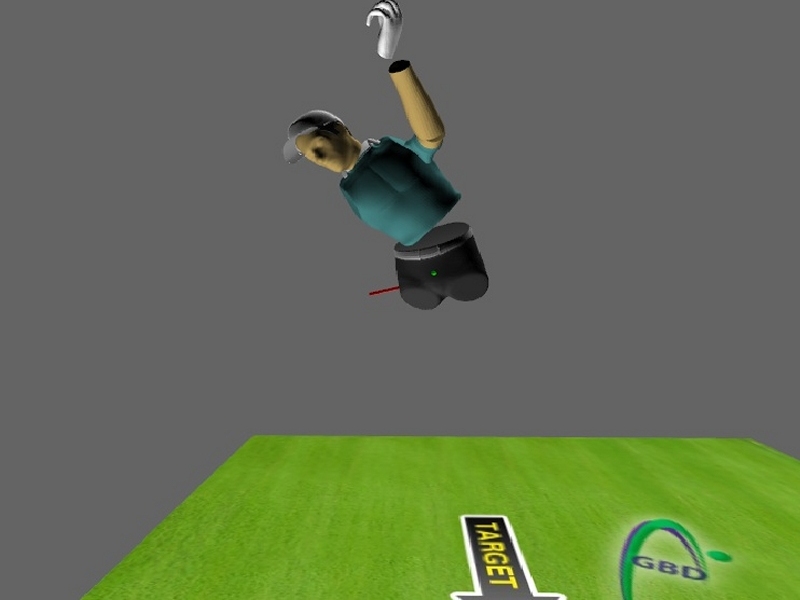
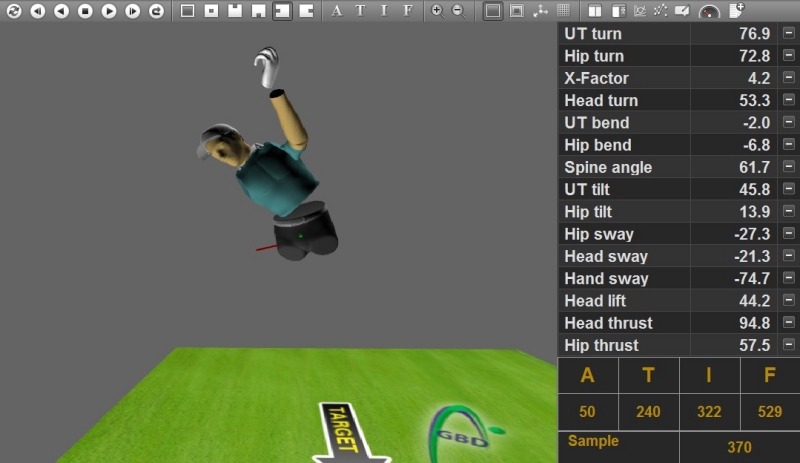
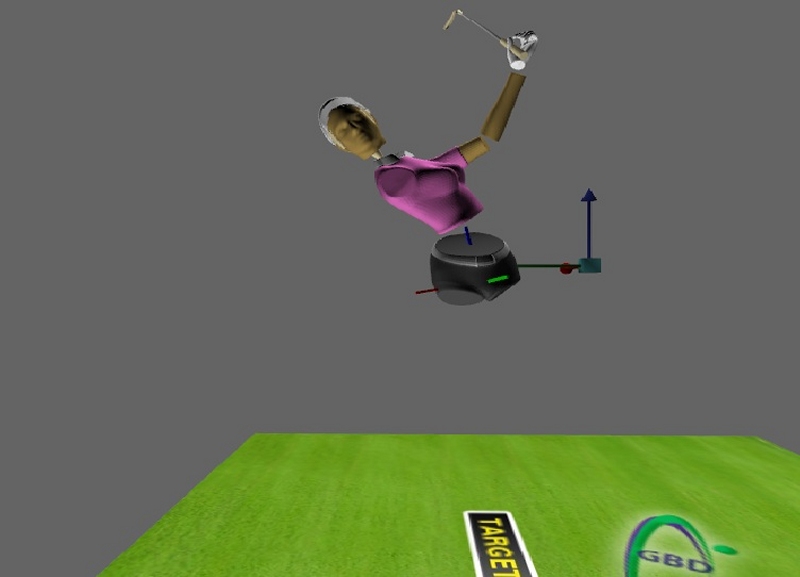
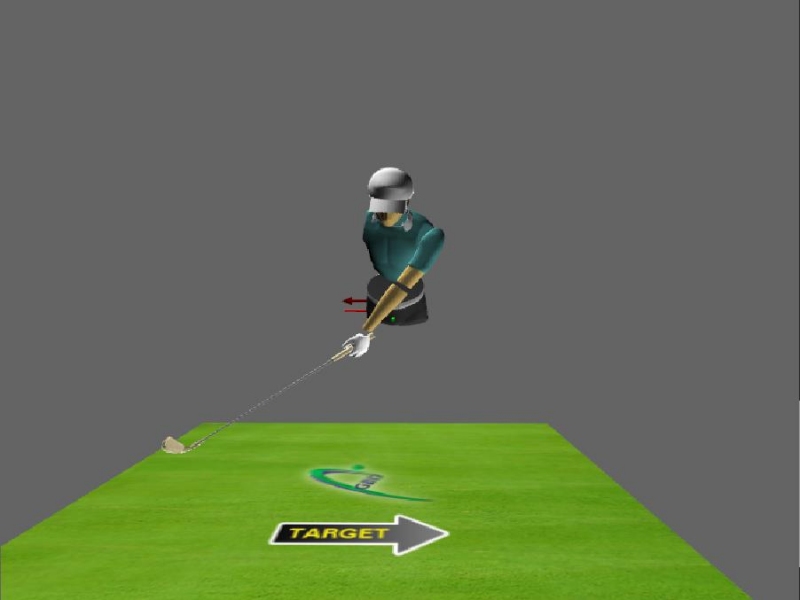
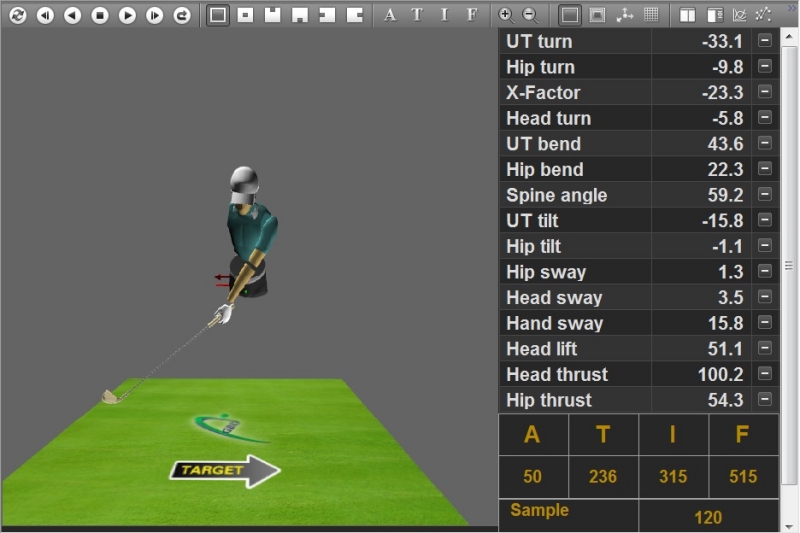
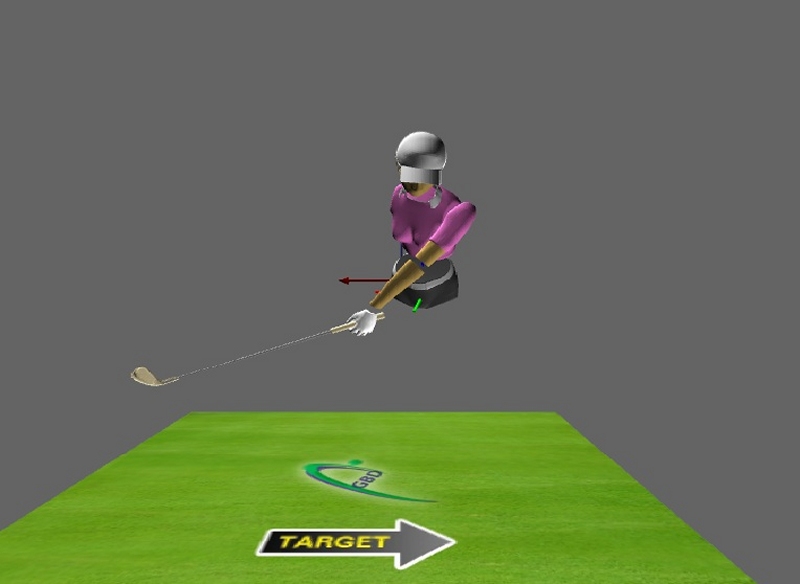
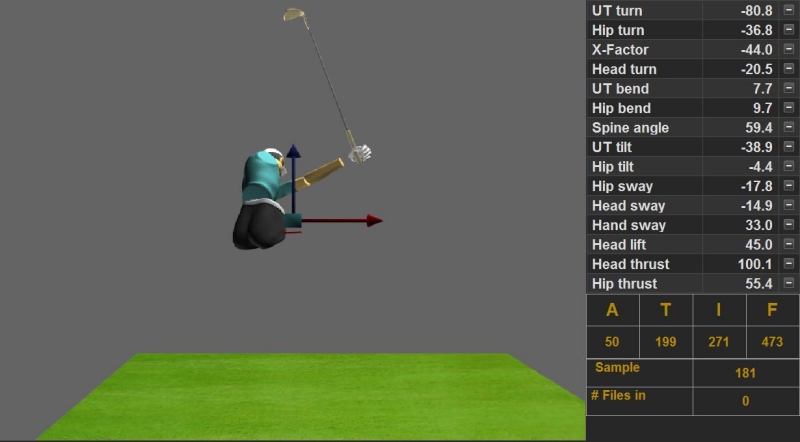
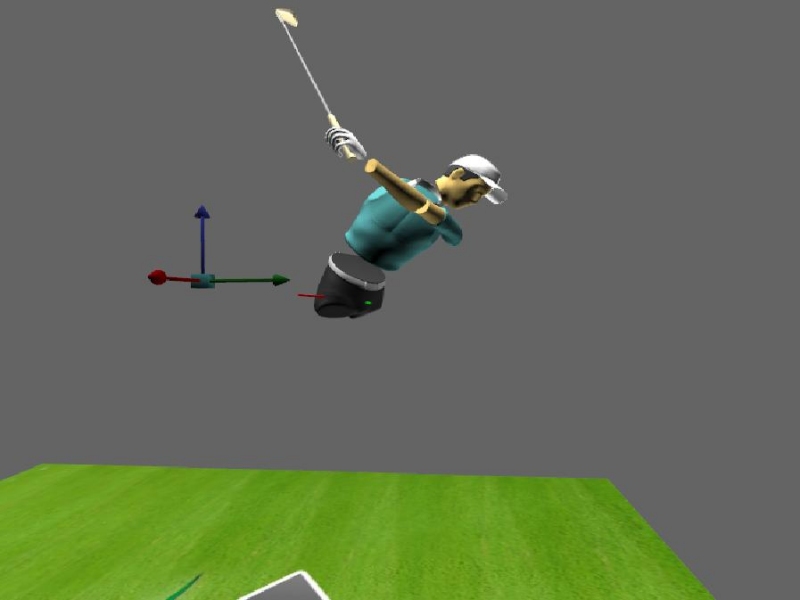
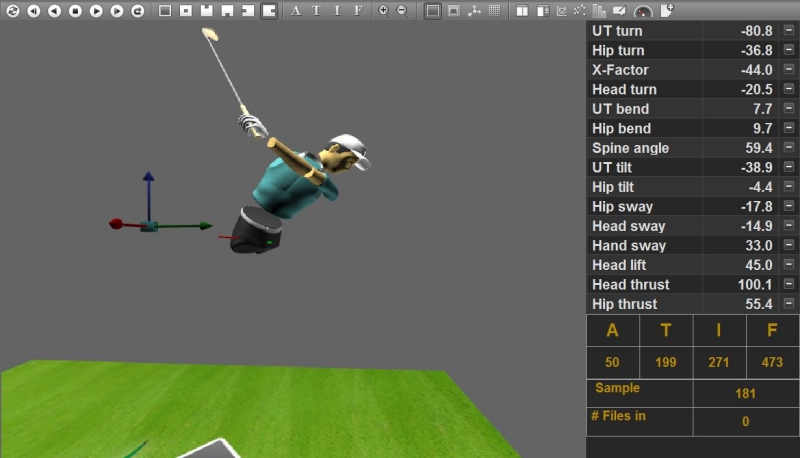
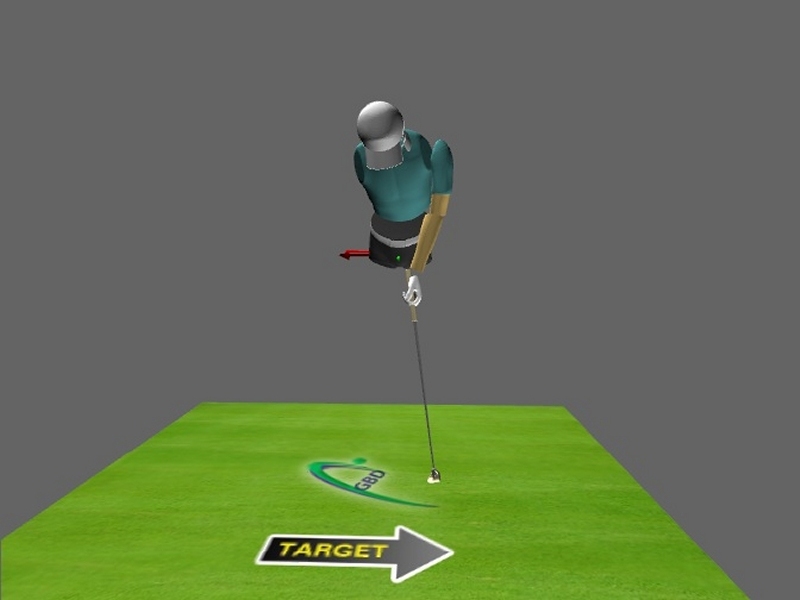
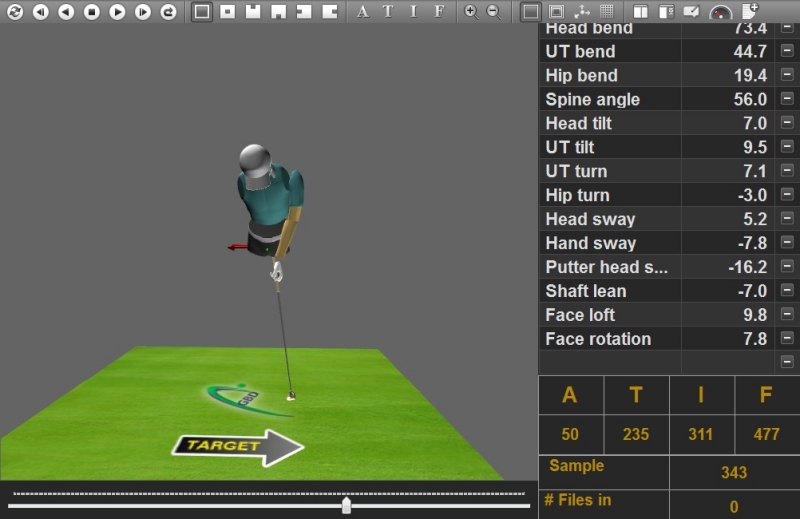
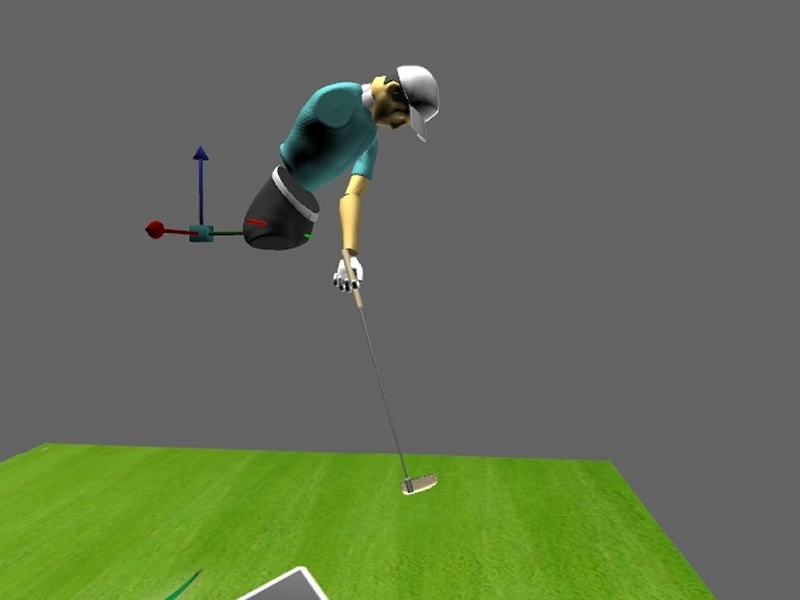
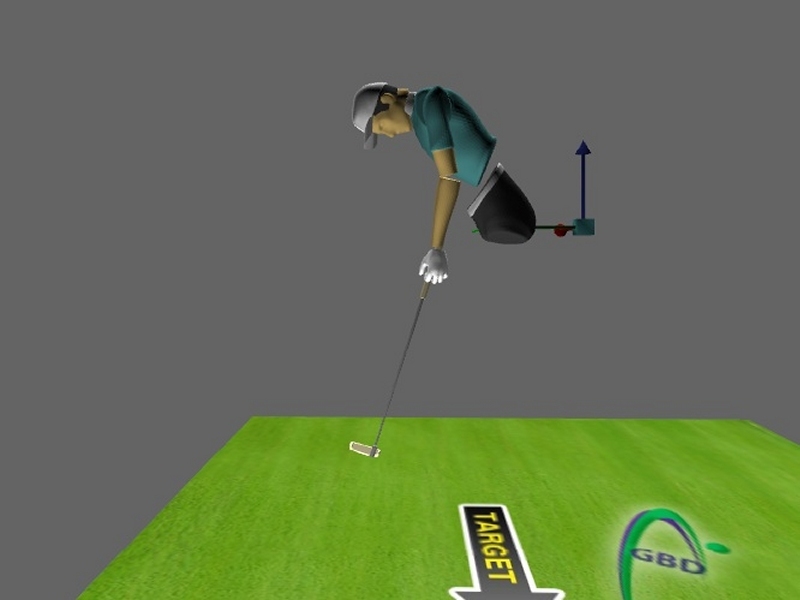
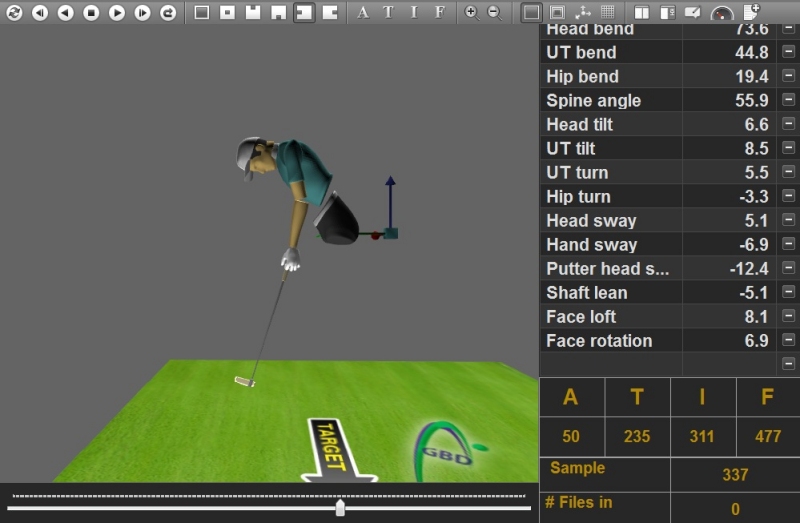
Below is a selection of images produced by our 3D Golf BioDynamics system that demonstrate the completeness of the analysis undertaken.

Click on a sample image or select from the list to the right to launch a larger slideshow for each set.

Standard Model Images

  • Front image 1
  • Front image 2
  • Rear image 1
  • Rear image 2
  • Down-the-line image 1
  • Down-the-line image 2
  • Target line image 1
  • Target line image 2

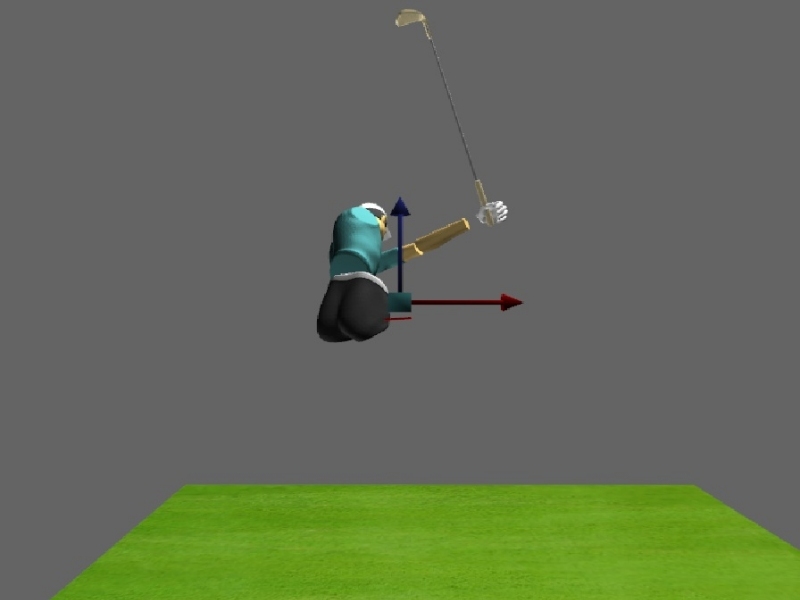
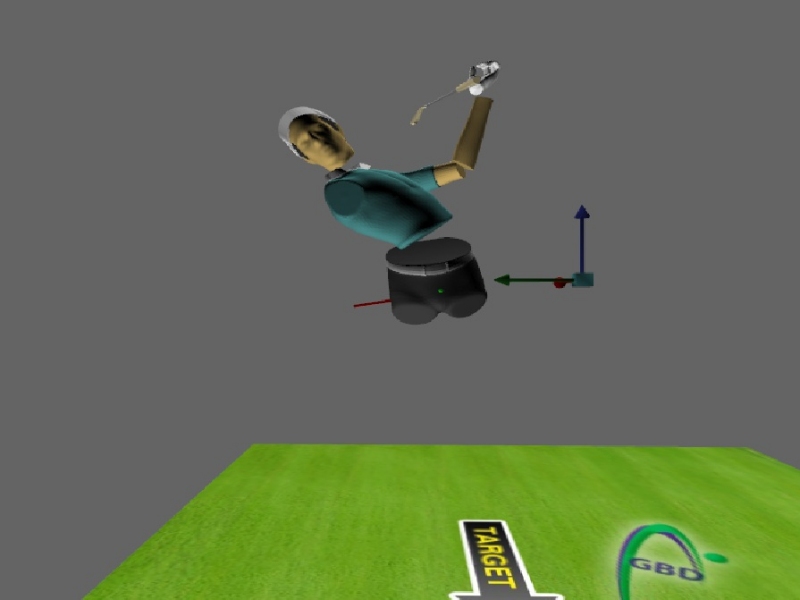
Club and Body Images

  • Club and body image 1
  • Club and body image 2
  • Club and body image 3
  • Club and body female
  • Front image 1
  • Front image 2
  • Front image female
  • Rear image
  • Down-the-line image 1
  • Down-the-line image 2

Putting Images

  • Front image 1
  • Front image 2
  • Down-the-line image 1
  • Down-the-line image 2
  • Target line image 1
  • Target line image 2
© 2008-20 Total Golf Analysis website by Bluefire