TGA
totalgolfanalysis.co.uk
Homepage  |  Contact Us
  • About TGA
    • The TGA team
    • Testimonials
    • News from TGA
  • Our services
    • 3D analysis
      • Golf BioDynamics
      • In-depth guide
      • A typical 3D session
      • Output - Reports
      • Output - Graphs
      • Output - Images
      • Output - Videos
    • Biofeedback training
    • Golf conditioning
    • Tailored services
    • More:
      • Case studies
      • FAQs
      • Fees
  • Where and when
    • Forthcoming events
    • Venues
      • Selsdon Park tuition
      • Styal Golf Club
  • Resources
    • Articles
    • Golf news headlines
    • Website links

The 3D Golf BioDynamics System

Overview GBD In-Depth 3D Sessions Reports Graphs Images Video

Sample Analysis Graphs

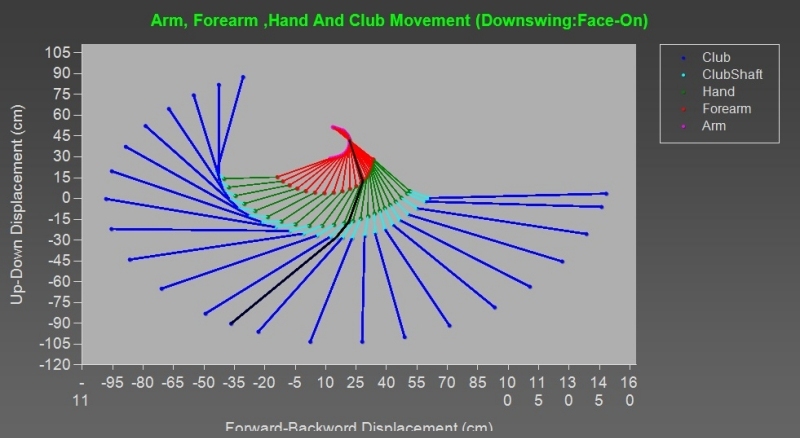
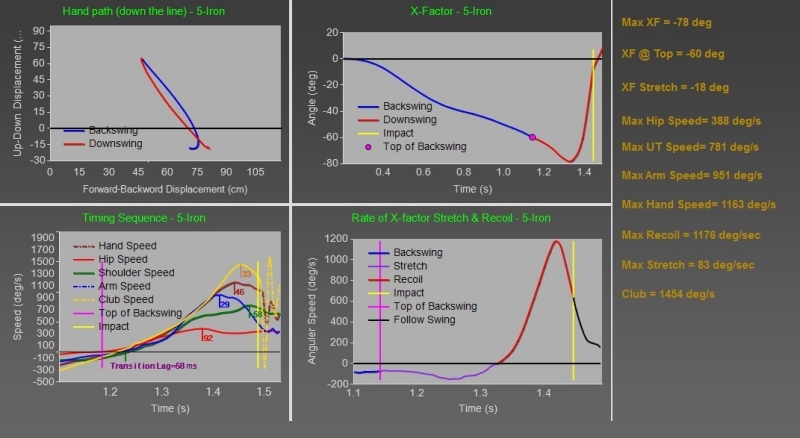
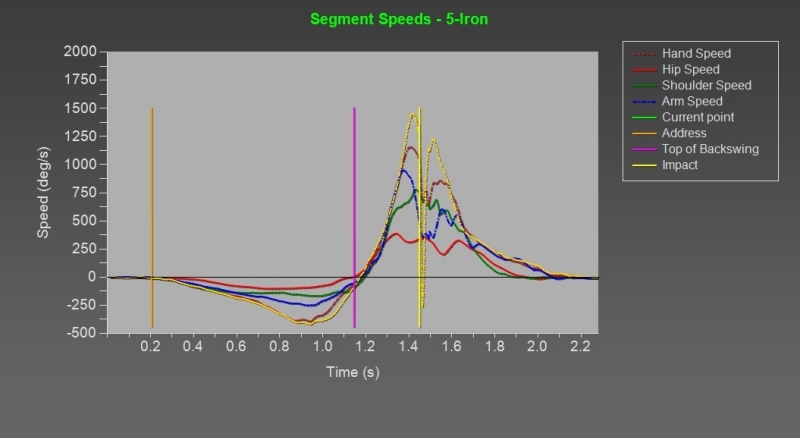
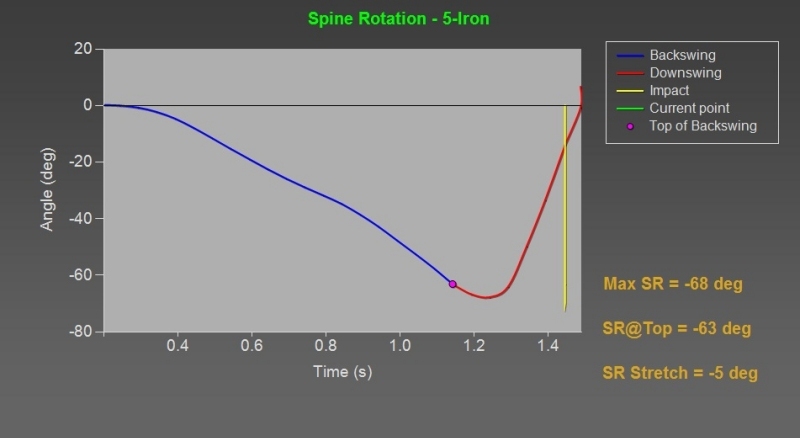
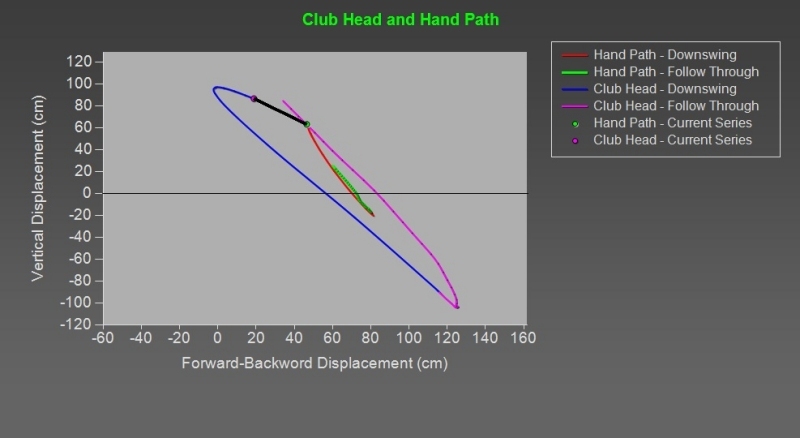
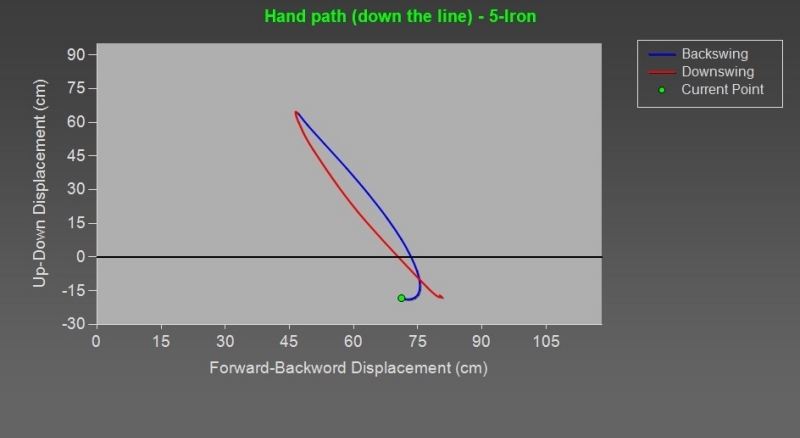
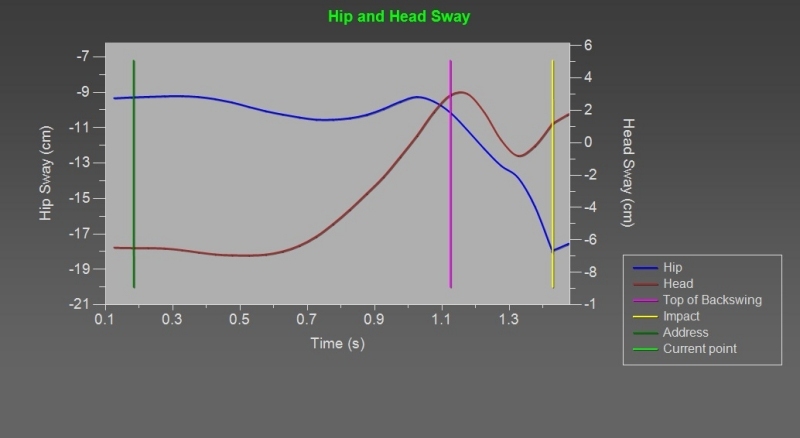
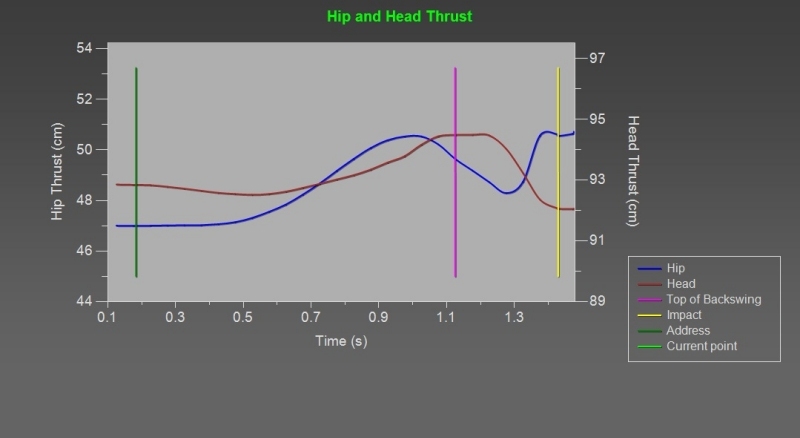
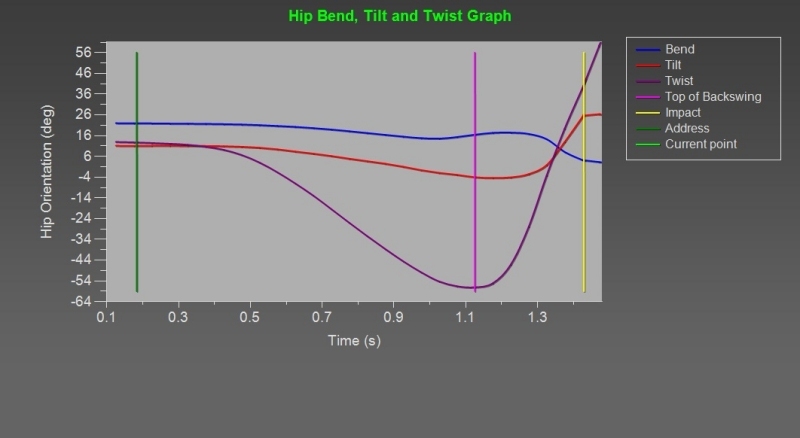
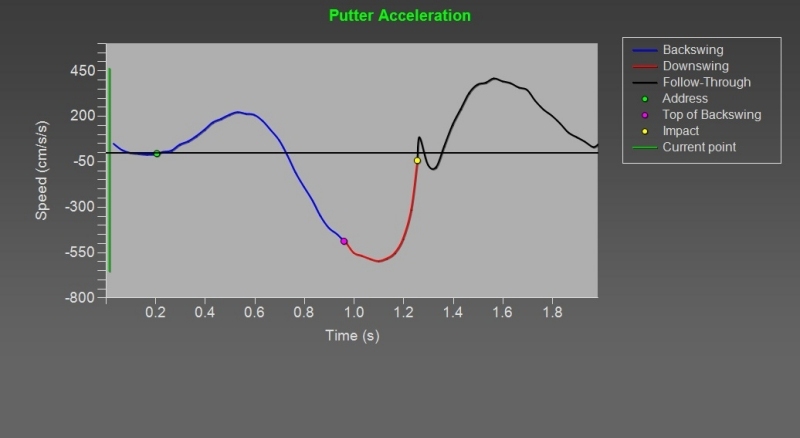
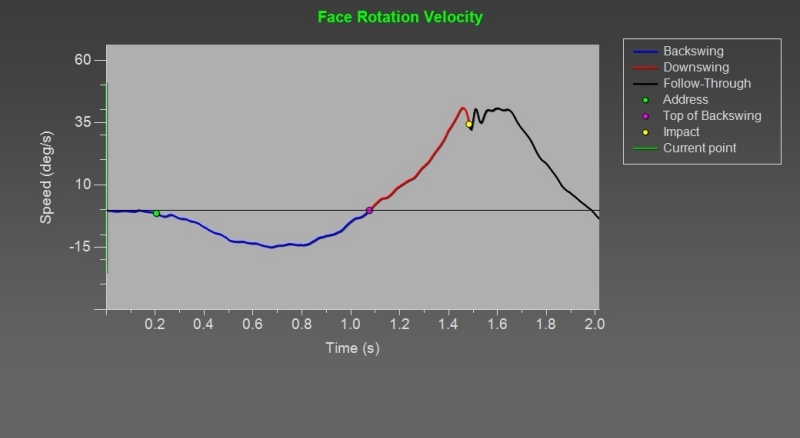
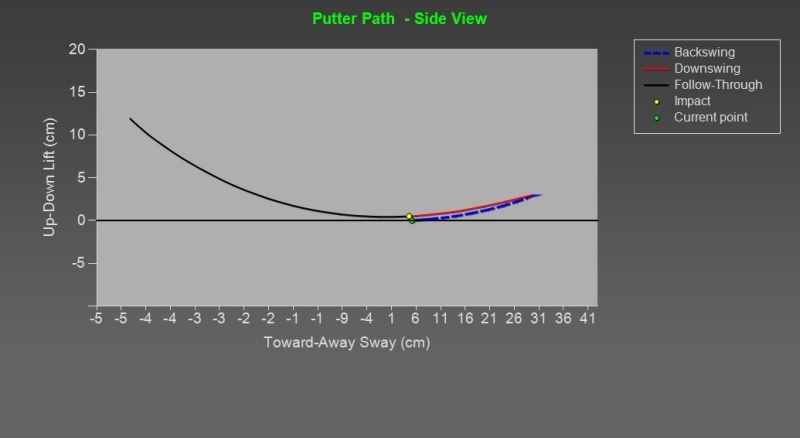
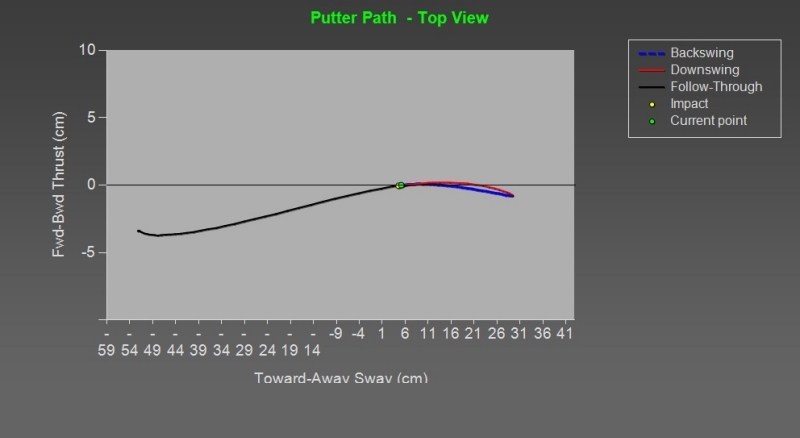
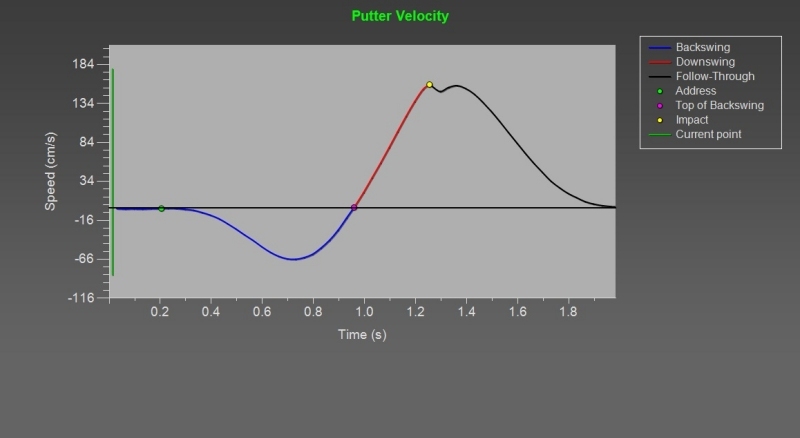
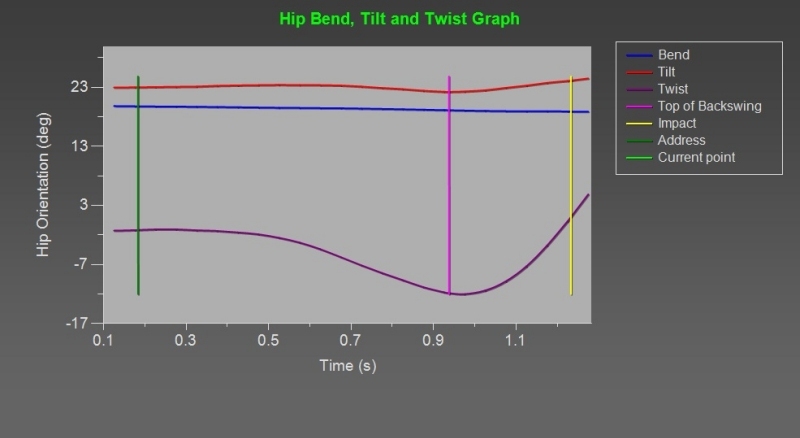
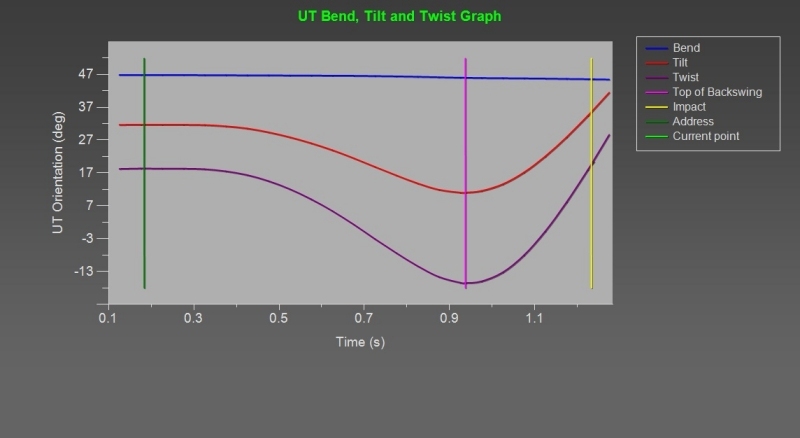
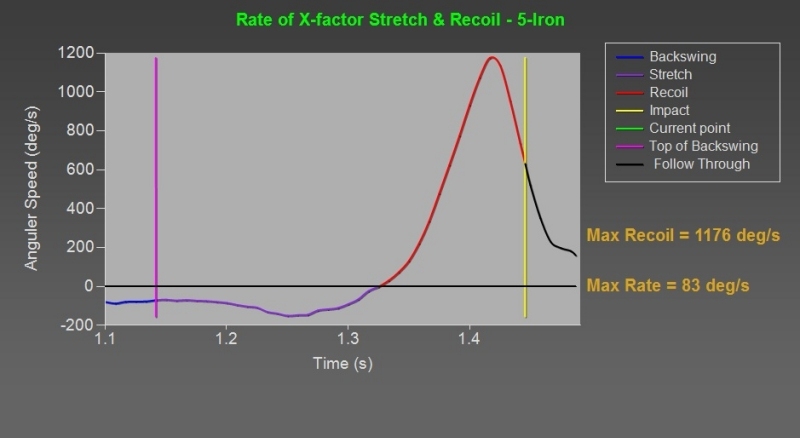
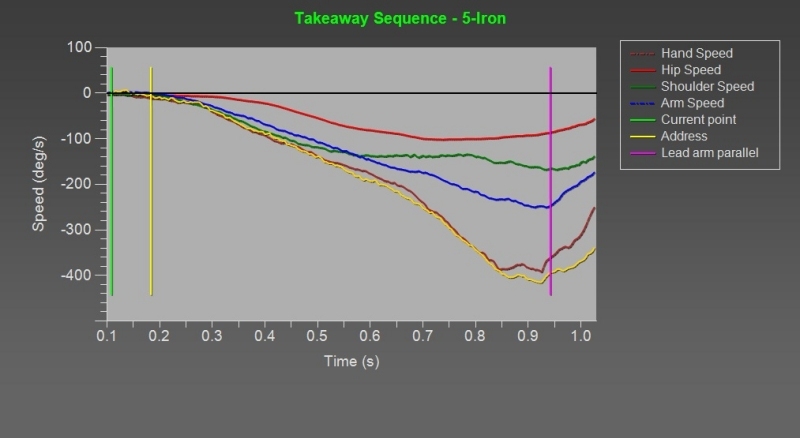
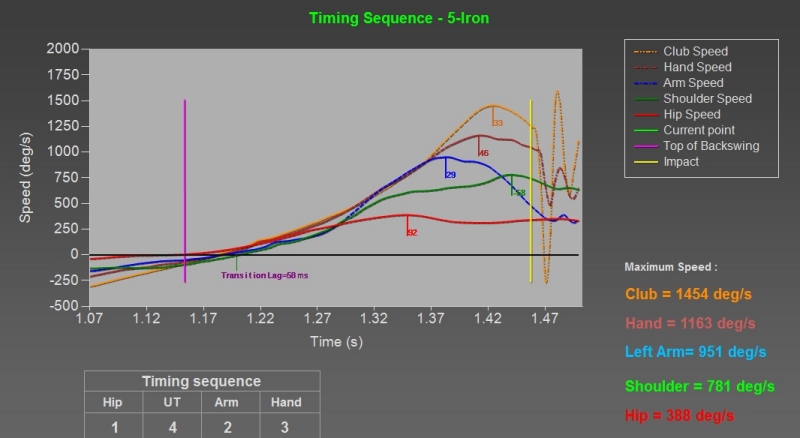
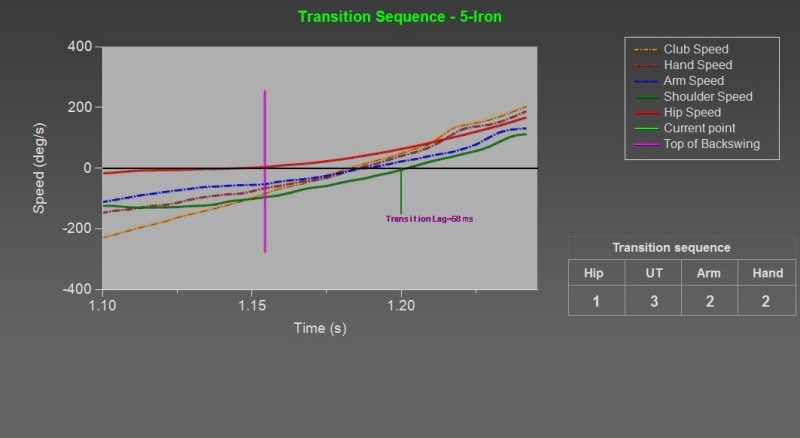
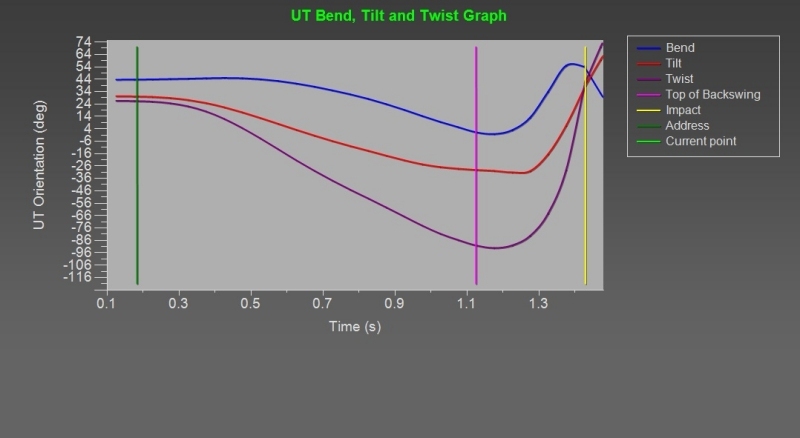
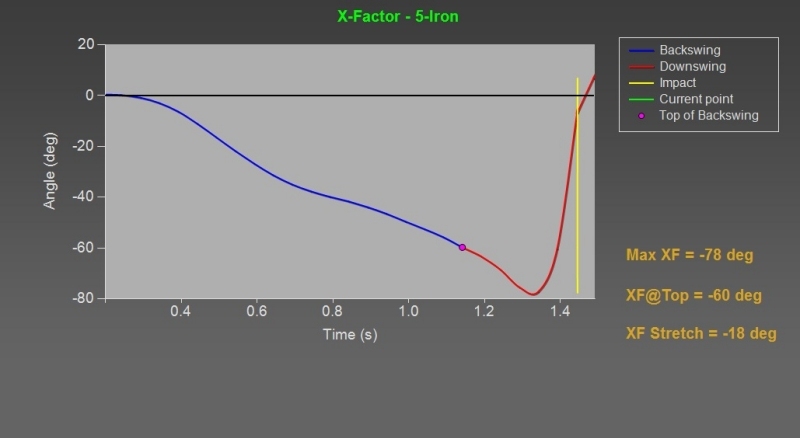
Below is a selection of graphs produced by our 3D Golf BioDynamics system that demonstrate the completeness of the analysis undertaken.


Segmental image front-on

Combination of graphs

Segmental speeds

Spine rotation

Click an image above for a slideshow of larger versions, or select from the full list of sample graphs:

  • Segmental image front-on
  • Club-head-hand path down the line
  • Hand path
  • Hip and head sway
  • Hip and head thrust
  • Hip bend, tilt and twist
  • Putter acceleration
  • Putter face rotation velocity
  • Putter path (side view)
  • Putter path (top view)
  • Putter velocity
  • Putting hip bend, tilt and twist
  • Putting torso bend, tilt and twist
  • Rate of stretch and recoil
  • Segmental speeds
  • Spine rotation
  • Takeaway sequence
  • Timing sequence
  • Transitional sequence
  • Upper torso bend, tilt and twist
  • X-factor
  • Combination of graphs
© 2008-20 Total Golf Analysis website by Bluefire